
How Montgomery Homes Used Power BI to Cut Build Delays
- GrowthBI

- Jun 19
- 5 min read
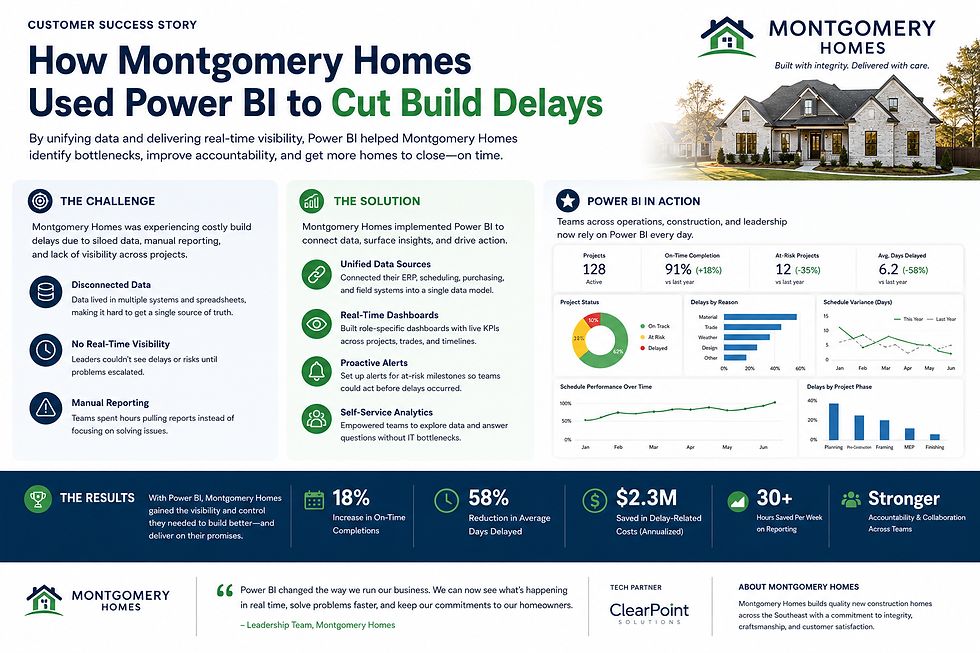
For a residential builder, delays are the most expensive problem there is. Every week a build runs over schedule, ties up working capital, frustrates clients, strains supplier relationships, and pushes back the next job in the pipeline. The cost is rarely a single line item; it is spread across finance, operations, and reputation, which is part of why delays are so easy to tolerate and so hard to fix.
Montgomery Homes, a New South Wales home builder, faced exactly this challenge, and used Power BI to turn scattered project data into a clear, shared picture of where time was actually being lost.
This is how a data-led approach helped Montgomery Homes identify the real causes of build delays and shorten timelines, and what other Australian builders and project-based businesses can learn from the same approach.
The Problem: Delays Without a Clear Cause
Like most builders, Montgomery Homes knew that some jobs ran late, but the reasons were buried across separate systems: scheduling software, supplier records, site reports, and finance, none of which spoke to each other. Identifying why a particular build slipped meant manually piecing together information after the fact, by which point the delay had already cost money and the lesson was rarely captured in a way that prevented the next one.
Without a single view of build progress against schedule, the leadership team could not see the patterns hiding in the data. Was a particular stage consistently slow across many jobs? Were specific suppliers quietly causing repeated holdups? Were delays concentrated in certain job types, or certain teams, or certain times of year? The data to answer these questions existed, but it was scattered, and it was never assembled into a form that revealed the patterns. As a result, the business was reacting to individual late jobs rather than fixing the systemic causes behind them.
This is a common trap in project-based businesses. Each delay feels like a one-off with its own particular story, a late supplier here, a weather event there, so the underlying patterns never get addressed. The information needed to see the pattern is present, but it is fragmented across tools, and fragmentation hides the signal.
The Solution: A Build Timelines Dashboard
GrowthBI connected Montgomery Homes' project, scheduling, and supplier data into a single Power BI model and built a build timelines dashboard. For the first time, the team could see every active job's progress against its planned schedule in one place, with delays flagged automatically and broken down by stage and by cause. This built directly on the timeframes work described in our Montgomery Homes build timelines case study.
The dashboard made the invisible visible.
Stages that consistently overran across many jobs stood out immediately, where before they had been hidden inside individual project files. Suppliers whose lead times were slipping were identified early, before they affected multiple builds, rather than after the damage was done. And the management team could finally act on patterns, addressing the stage or dependency that caused the most delay across the whole portfolio, instead of firefighting one late job at a time.
Importantly, the dashboard was designed for the people who would use it, site and operations managers, not for analysts. It showed the handful of things that mattered at a glance and let users drill into the details of a specific job only when they needed to. A dashboard that requires interpretation does not change behaviour; one that answers the obvious question instantly does.
The Results: Shorter Timelines and Better Decisions
With clear, shared visibility into where time was being lost, Montgomery Homes could target the specific stages and dependencies that caused the most delay rather than spreading effort thinly across every possible cause. Decisions about scheduling, supplier management, and resourcing were made on evidence rather than instinct, and the conversations in management meetings shifted from arguing about what was happening to deciding what to do about it.
The same data discipline contributed to broader operational gains beyond just timelines, including the productivity improvements covered in how Montgomery Homes boosted employee productivity by 15%. Once a business can see its operations clearly, improvement in one area tends to surface opportunities in others, because the same connected data that exposes delays also exposes inefficiency.
What Other Builders and Project Businesses Can Learn
The lesson is not specific to home building. Any project-based business, whether in construction, professional services, fit-out, or manufacturing, loses time to causes it cannot see clearly, because the data that would reveal those causes is scattered across separate tools. The first step to reducing delays is always the same: measure them properly. Where exactly is time lost, at which stage, and why? Until those questions can be answered with data rather than anecdote, improvement is guesswork.
Once the causes are visible, improvement follows naturally, because effort can be directed at the few things that matter most rather than spread across everything. This is the essence of measuring operational efficiency for growth: you cannot improve what you cannot see, and a connected analytics model is what makes the invisible visible.
The practical starting point for any project business is to bring scheduling, supplier, and project-status data into one model, then build a single view of progress against plan with delays flagged automatically. It does not require a large or complex system to begin delivering value; it requires connecting the data that already exists into a form that reveals the patterns.
Frequently Asked Questions
How does Power BI help reduce project delays?
Power BI connects scheduling, supplier, and project data into one view that shows progress against plan and flags delays automatically. This lets a business see which stages and dependencies cause the most delay across all its jobs and act on those patterns, rather than reacting to individual late jobs one at a time. The shift from firefighting to pattern-fixing is where the time savings come from.
Can Power BI connect to construction scheduling software?
Yes. Power BI connects to most construction and project management platforms via their APIs or database exports, pulling schedule, progress, milestone, and supplier data. GrowthBI configures these connections as part of a build timelines analytics project and advises on the most reliable connection method for each system involved.
Is this approach only for home builders?
No. Any project-based business that runs work against schedules, in construction, professional services, manufacturing, or fit-out, can use the same approach to measure where time is lost and shorten delivery timelines. The principle, connect the data, make progress against plan visible, act on the patterns, is industry-agnostic.
How long does it take to build a project timelines dashboard?
For a business with scheduling, supplier, and project data in a few systems, GrowthBI typically delivers a working build timelines dashboard in four to six weeks, including data connections, the model build, dashboard design, and training for the operations team who will use it day to day.
What data do we need to get started?
At minimum, your planned schedules and your actual progress data, so the dashboard can compare the two and flag slippage. Adding supplier lead-time data and stage-level detail makes the analysis considerably richer, because it lets you attribute delays to specific causes. GrowthBI helps identify which of your existing data sources to connect first for the fastest path to value.
See Where Your Projects Lose Time
If your business runs projects against deadlines and you cannot clearly see where delays come from, you are losing time and money to causes you have never properly measured. A build timelines dashboard makes those causes visible, shared, and actionable, turning delay from an accepted cost of doing business into a problem you can systematically reduce.
GrowthBI builds project and operations analytics for Australian builders and project-based businesses. Book a free consultation to discuss how a build timelines dashboard could work for your business.


