Data and AI Consultancy
E-commerce
Grow E-commerce Store With Data Analytics
Track orders, forecast sales, reduce churn, and spot winning products without switching tabs or guessing what’s working.
Dashboard wireframe created using mokkup.ai
Forward Looking Brands Choose GrowthBi


The Problem
In e-commerce, data lives in disconnected platforms. This leads to overselling, understocking, misaligned campaigns, and churn that goes unnoticed until it hits your bottom line.
Who is it for?
Target Audience
Executive Teams (C-Suite in Retail)
Require high-level overviews of sales trends, profit margins, and key performance indicators to guide overall business strategy.
Inventory Management Teams
Focus on tracking inventory levels, and supply chain efficiency to ensure optimal stock availability.
Customer Support Managers
Need insights into support ticket volumes, resolution times, and common customer issues to improve service quality and streamline operations.
Marketing Teams
Track customer engagement, campaign performance, and customer acquisition strategies to drive sales and retention.
E-commerce Managers
Need dashboards to track in-store and online sales performance, manage inventory, and monitor staff productivity.
UX/Product Teams
Analyze user behavior, cart abandonment rates, and navigation patterns to optimize the online shopping experience and boost conversions.
Get Complete E-commerce Dashboard
01
Digital Marketing Dashboard
Target Audience: Marketing Managers, Digital Strategy Leads, Business Development
Key Metrics: This dashboard measures digital campaign effectiveness and ROI to help construction firms generate more leads.
-
Total Spend: Advertising and campaign budget spent within a timeframe.
-
Total Sales Revenue: Revenue directly attributed to marketing activities.
-
Website Traffic: Total visits to project landing pages or service websites.
-
Conversion Rate: Percentage of visitors completing inquiry or signup forms.
-
Clickthrough Rate (CTR): Ratio of ad impressions to clicks.
-
Cost Per Acquisition (CPA): Average cost to acquire a lead or customer.

Dashboard wireframe created using mokkup.ai
02
Inventory | Sales vs Stock
Target Audience: Inventory Managers, Sales Directors, Procurement Teams
Key Metrics: This dashboard compares product availability to sales trends to manage inventory turnover and supply chain efficiency.
-
Inventory Value: Total monetary value of stock on hand.
-
Inventory Value %: Inventory as a percentage of total assets or turnover.
-
Number of Products: Count of distinct SKUs in stock.
-
Average Daily Sales: Sales velocity based on historical sales performance.

Dashboard wireframe created using mokkup.ai
03
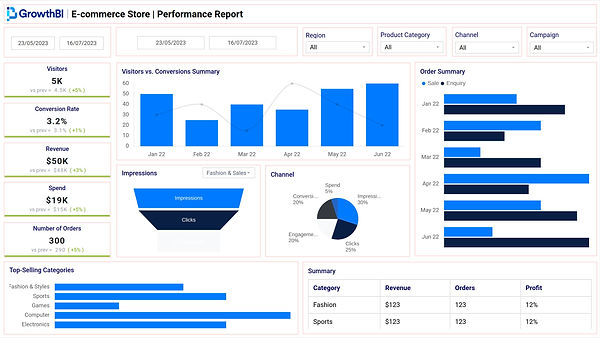
E-commerce Store Performance Report
Target Audience: E-commerce Executives, Marketing Teams, Digital Analysts
Key Metrics: This high-level dashboard tracks daily and campaign-based performance, helping teams quickly assess what’s working:
-
Conversion Rate: Measures how well traffic converts into revenue.
-
Total Visitors: Monitors traffic to your store across channels.
-
Revenue and Spend: Tracks gross income against marketing investment.
-
Number of Orders: Measures transaction volume across time periods.
Dashboard wireframe created using mokkup.ai
04
Product Performance Overview
Target Audience: Merchandising Managers, Product Teams, Retail Analysts
Key Metrics: This dashboard helps understand what’s selling, who’s buying, and how products contribute to revenue:
-
Distinct SKUs Sold: Tracks how many unique products are purchased.
-
Average Order Value (AOV): Measures the average spend per basket.
-
Customer Insights: Highlights top purchasing customers and patterns by product.

Dashboard wireframe created using mokkup.ai
05
Customer Churn
Dashboard
Target Audience: Retention Teams, CRM Managers, Lifecycle Marketers
Key Metrics: This dashboard helps e-commerce brands understand why customers leave and where intervention can reduce churn:
-
Gender Share of Churn: Identifies churn behavior by gender.
-
Active to Churn Transition: Tracks the lifecycle of customers before they churn.
-
Card-to-Churn Rates: Measures how payment method correlates with retention.
-
Churn by Country: Analyzes geographic churn patterns.
-
Churn by Age Range: Identifies demographic trends in customer loss.
-
Credit Score to Churn: Connects credit behavior to retention risk.

Dashboard wireframe created using mokkup.ai
Dashboard Features
Custom Metrics for Teams
Each team (store managers, product teams, marketing) can view personalized dashboards tailored to their specific KPIs and metrics.
Predictive Analytics
Machine learning models to predict trends like customer churn, sales spikes, and inventory needs based on historical data.
Multi-Page Design
Easy navigation between dashboards tracking different aspects of the business (e.g., sales, inventory, customer loyalty), with drill-down capabilities.
Interactive Filters
Customizable filters that allow users to filter data by region, store location, product category, or date range for deeper insights.
Real-Time Data
Dashboards update in real time, allowing teams to act quickly on critical insights, such as inventory shortages or sales spikes.
Performance Comparisons
Graphs, bar charts, and heatmaps that allow comparison of different stores, product lines, or marketing campaigns.
How We Deliver for E-commerce
At GrowthBI, we offer a straightforward process to help you take control of your e-commerce data and turn it into a powerful tool for growth:
Here's how it works:

We Begin With a Dashboard Mockup
We begin by understanding your business needs and create a tailored dashboard mockup within 1–2 days. You’ll see how your e-commerce data will look in action before we move further.
01
We Build Your Data Infrastructure
Our team connects your sales channels, marketing platforms, and inventory systems. We create reliable data models and infrastructure to ensure accuracy and consistency across every metric.
02
We Deliver Interactive Dashboards
You get fully functional dashboards with drill-down capabilities that track KPIs like sales, conversion rates, inventory movement, and customer retention. Every insight is structured to guide decisions that increase growth and profitability.


