Data and AI Consultancy
Financial Services
Take Control of Financial Performance with Smart Dashboards
Move beyond fragmented reports and manual spreadsheets. Our financial analytics dashboards bring clarity to your cash flow, risk, revenue, and operational metrics.

Dashboard wireframe created using mokkup.ai
Forward Looking Brands Choose GrowthBi


The Problem
Financial institutions operate in a data-intensive environment, but decision-makers are often buried under static reports, outdated spreadsheets, and disconnected systems. Without real-time financial visibility, teams face delayed insights, regulatory risks, and missed growth opportunities. In a market where timing and precision matter, poor data integration slows down strategy and hinders profitability.
Who is it for?
Target Audience
CFOs & Finance Executives
Monitor cash flow, profitability, compliance metrics, and growth indicators in real time.
Risk & Compliance Teams
Track exposure, regulatory benchmarks, and risk trends through unified dashboards.
Investment Analysts
Gain visibility into portfolio performance, asset allocation, and market shifts.
Operations Leaders
Use cost-efficiency metrics to manage departmental performance and service delivery.
Product Managers
Analyze profitability by financial product, customer usage trends, and retention behavior.
Client Relationship Managers
Track client value, transaction patterns, and engagement metrics to tailor services.
Get Complete Financial Services Dashboard
01
Fixed Deposit Analysis
Target Audience: Retail Banking Managers, Product Heads, Customer Relationship Executives, Finance Analysts
Key Metrics:This dashboard provides a real-time overview of fixed deposit performance, segmented by customer profiles and risk categories:
-
Active Customers: Total number of customers with open fixed deposit accounts.
Maximum Score: Highest customer score indicating strong credit or deposit reliability.
-
Special Rate Customers: Number of clients granted custom or promotional interest rates.
-
Minimum Score: Lowest customer score, highlighting segments with potential risk.
Dashboard wireframe created using mokkup.ai
02
Financial Ratios Report
Target Audience: CFOs, Treasury Managers, Financial Controllers, Internal Auditors
Key Metrics:This dashboard consolidates key liquidity and solvency ratios essential for monitoring financial health and operational sustainability:
-
Cash Ratio: Measures ability to cover short-term liabilities with cash on hand.
Current Ratio: Indicates the firm’s capability to meet short-term obligations with current assets.
-
Quick Ratio: A stricter liquidity ratio excluding inventory from assets.
-
Absolute Liquidity Ratio: Reflects highly liquid asset coverage without relying on receivables.

Dashboard wireframe created using mokkup.ai
03
Credit Churn Analytics
Target Audience: Credit Risk Officers, Portfolio Managers, CRM Teams, Data Analysts
Key Metrics:This dashboard monitors churn in credit product users and identify high-risk segments:
-
Total Customers: Number of credit users under active monitoring.
-
Minimum Score: Lowest score within the customer base, flagging high-risk churn candidates.
-
Maximum Score: Highest score, indicating financially strong and loyal customers.
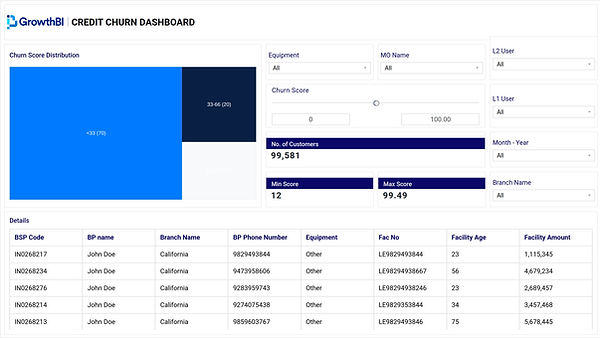
Dashboard wireframe created using mokkup.ai
04
Investment Analysis Dashboard
Target Audience: Investment Advisors, Wealth Managers, Portfolio Heads, Financial Planners
Key Metrics: This dashboard provides performance insights on client investment products and overall ROI:
-
Total Maturity Amount: Cumulative expected return at the end of investment terms.
Total Principal Amount: Aggregate initial capital invested across all products.
-
Average ROI: Weighted average return across schemes and investment types.
-
Number of Schemes: Active investment options available and in circulation.
-
Investment Surplus: Gap between expected returns and actual realized amounts.

Dashboard wireframe created using mokkup.ai
05
Audit Dashboard
Target Audience: Internal Audit Teams, Compliance Officers, Risk Managers, CFOs
Key Metrics:This dashboard tracks audit progress and identify areas that require immediate follow-up using this centralized compliance dashboard:
-
Total Audits: Overall audits initiated during a specified time frame.
-
Audits Pending: Audits yet to begin or awaiting initial review.
Audits in Progress: Audits currently under review.
-
Audits Completed: Audits finalized with outcomes recorded.

Dashboard wireframe created using mokkup.ai
Dashboard Features
Real-Time Financial Health Monitoring
Cash flow, revenue, cost, and net profit metrics updated continuously.
Performance Benchmarking
Compare branch, product line, or advisor performance against internal goals.
Regulatory Compliance Views
Dashboards mapped to industry reporting standards and audit-ready KPIs.
Custom Role-Based Access
Each user sees only what matters to them from exec overviews to analyst detail.
Risk Exposure Drilldowns
Interactive visuals showing financial risk levels by region, asset type, or portfolio.
Forecasting & Projections
Visual models for budget planning, revenue forecasting, and investment performance.
How We Deliver for Financial Services
At GrowthBI, we offer a straightforward process to help you take control of your financial services data and turn it into a powerful tool for growth:
Here's how it works:

We Create a MockUp Dashboard
Within 1–2 business days, we send you a dashboard layout based on your goals. You see your KPIs before any data work begins.
01
We Build Your Data Infrastracture
We build clean data models, and ensure secure and compliant integration. Then we build data models to unify your project, financial, and logistics data in one source.
02
We Create Dashboard With Drill Down Functionality
You receive intuitive, real-time dashboards with drill-down views so you can monitor construction progress, review warehouse performance, and make timely, cost-effective decisions.


