HR Analytics
HR Analytics With Data Driven Insights
Your people are your most valuable asset but without data, managing workforce performance, engagement, and retention becomes reactive. GrowthBI helps you give HR leaders the insights they need to make informed decisions.

Dashboard wireframe created using mokkup.ai
Forward Looking Brands Choose GrowthBi


The Problem
HR teams often rely on basic reports to make critical workforce decisions. Without deep insights, it’s difficult to understand what’s driving employee turnover, how to measure performance fairly, or where to focus talent development.
GrowthBI played a pivotal role in our growth at Rate My Agent in US region. Regular insights from Tableau dashboards were instrumental in honing our growth strategy.
Rohan Chandler

.png)
Chief Commercial Officer, Rate My Agent
GrowthBI helped us create Customer Retention Dashboards by setting up Fivetran for us. We gained clarity into marketing and sales conversion.
Ankur Gattani

Chief Growth Officer, WebEngage
Who is it for?
Target Audience
Chief Human Resources Officer (CHRO)
Responsible for overseeing all aspects of human resources strategy. Requires dashboards that track key HR metrics such as employee turnover, headcount, and workforce diversity.
Sales HR Managers
Focus on day-to-day HR operations, including employee performance, hiring, and engagement. Need dashboards to monitor recruitment pipelines, employee satisfaction, and compliance.
Recruiters
Responsible for talent acquisition. Require dashboards to track the recruitment pipeline, time-to-hire, and candidate quality.
Employee Engagement Specialists
Focus on improving employee satisfaction and retention. Require insights into engagement surveys, employee feedback, and retention rates
Learning & Development Teams
Focus on employee growth and development. Require dashboards to monitor training completion rates, employee skill development, and learning outcomes
Get Complete HR Analytics
01
Recruitment and Talent Acquisition Dashboard
Target Audience: Recruiters, HR Managers, CHRO
Key Metrics: This dashboard helps track the recruitment process, including time-to-hire, quality of hire, and pipeline performance:
-
Time-to-Hire: Average number of days taken to fill open positions.
Recruitment Funnel: Number of candidates at each stage of the hiring process (applications received, interviews conducted, offers extended, hires made). -
Cost per Hire: Total recruitment costs (advertising, recruiter fees, etc.) divided by the number of new hires.
-
Source of Hire: Breakdown of hires by recruitment channel (e.g., job boards, referrals, agency, direct applications).
-
Offer Acceptance Rate: Percentage of offers extended that are accepted by candidates.
-
Candidate Quality: Post-hire performance scores of new hires (as measured by performance reviews during the first 6-12 months).
Dashboard wireframe created using mokkup.ai
02
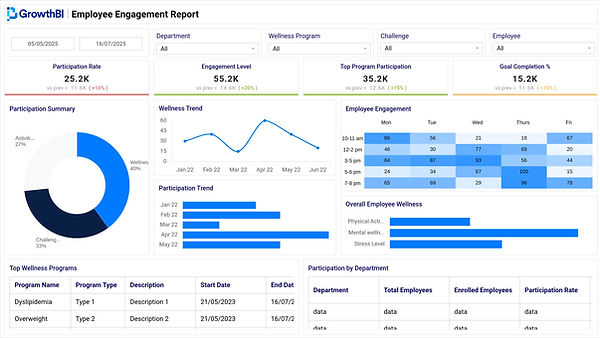
Employee Engagement and Satisfaction Dashboard
Target Audience: Employee Engagement Specialists, HR Managers, CHRO
Key Metrics: This dashboard tracks employee engagement levels, feedback, and overall job satisfaction, providing insights into areas that need improvement:
-
Engagement Scores: Results from employee engagement surveys, including overall satisfaction and engagement scores by department or location.
-
Pulse Survey Results: Real-time feedback on specific areas of concern, such as work-life balance, management support, or career development.
-
Employee Net Promoter Score (eNPS): Measures the likelihood of employees recommending the company as a good place to work.
-
Turnover Risk: Identification of employees at risk of leaving based on low engagement scores, feedback, or performance trends.
-
Participation Rate: Percentage of employees who completed engagement or satisfaction surveys.
-
Top Issues: Key concerns raised in employee feedback (e.g., compensation, work environment, workload).
Dashboard wireframe created using mokkup.ai
03
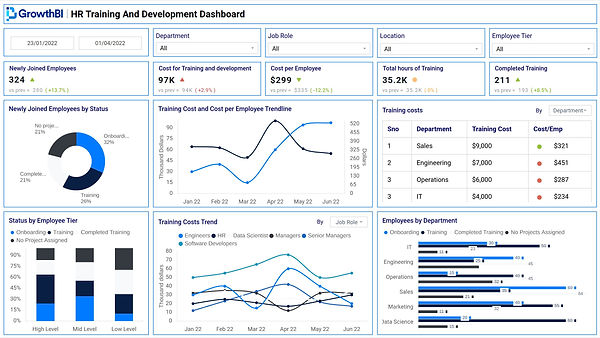
Training and Development Dashboard
Target Audience: Learning & Development Teams, HR Managers, CHRO
Key Metrics: This dashboard helps track employee development initiatives, training completion rates, and skill-building programs:
-
Training Completion Rate: Percentage of employees who have completed mandatory or optional training programs.
-
Skill Development: Number of employees completing training related to new skills or professional development (e.g., leadership training, technical skills).
-
Learning Outcomes: Post-training assessments to evaluate the effectiveness of the training programs.
-
Training Hours per Employee: Average number of training hours completed per employee over a specific time period.
-
Certification Tracking: Percentage of employees with completed certifications or qualifications.
-
Employee Feedback on Training: Ratings and feedback on the relevance and quality of the training programs offered.
Dashboard wireframe created using mokkup.ai
04
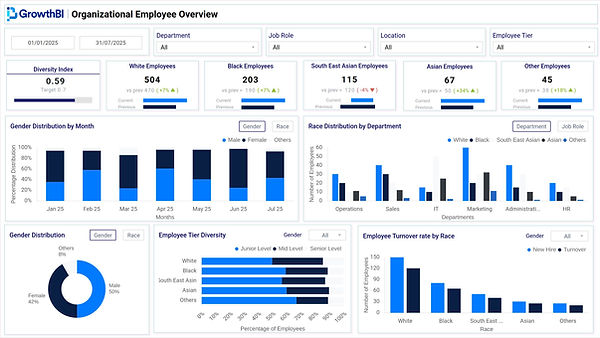
Organizational Employee Overview
Target Audience: CHRO, HR Managers, Leadership
Key Metrics; This dashboard tracks the overall workforce composition, turnover rates, and new hires, helping HR teams manage staffing levels and forecast workforce needs:
-
Total Headcount: Breakdown of current employees by department, location, or role.
-
Turnover Rate: Percentage of employees who left during a specific period, broken down by voluntary and involuntary turnover.
-
New Hires vs. Exits: Comparison of how many employees have been hired and how many have left over time.
-
Employee Tenure: Average tenure of employees by department, location, or job role.
-
Diversity Metrics: Breakdown of headcount by gender, ethnicity, or other diversity criteria.
Dashboard wireframe created using mokkup.ai
05
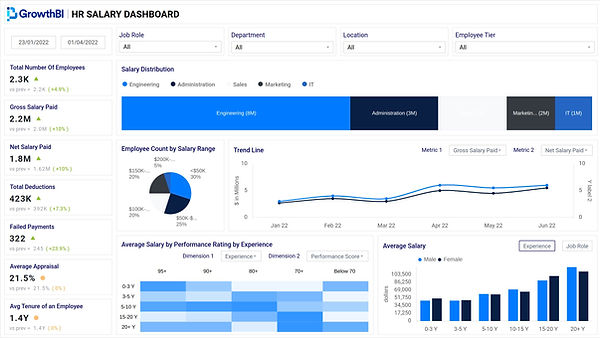
HR Salary Dashboard
Target Audience: HR Managers, CHRO, Payroll and Benefits Administrators
Key Metrics: This dashboard focuses on HR compliance, ensuring the organization meets legal and regulatory requirements:
-
Policy Compliance: Percentage of employees who have completed mandatory compliance training (e.g., anti-harassment, data privacy, workplace safety).
-
HR Audits: Status of internal or external audits (e.g., payroll audits, benefits audits) and compliance with labor laws.
-
Employee Documentation: Tracking of mandatory employee documentation (e.g., signed contracts, non-disclosure agreements, work permits).
-
Legal Cases: Overview of any ongoing HR-related legal cases, including employment disputes, discrimination claims, or labor law violations.
-
Employee Grievances: Number and type of employee grievances filed, with trends over time.
-
Compliance Deadlines: Upcoming deadlines for regulatory filings or required employee certifications.
Dashboard wireframe created using mokkup.ai
06
HR Performance Dashboard
Target Audience: HR Managers, CHRO, Payroll and Benefits Administrators
Key Metrics: This dashboard focuses on HR compliance, ensuring the organization meets legal and regulatory requirements:
-
Policy Compliance: Percentage of employees who have completed mandatory compliance training (e.g., anti-harassment, data privacy, workplace safety).
-
HR Audits: Status of internal or external audits (e.g., payroll audits, benefits audits) and compliance with labor laws.
-
Employee Documentation: Tracking of mandatory employee documentation (e.g., signed contracts, non-disclosure agreements, work permits).
-
Legal Cases: Overview of any ongoing HR-related legal cases, including employment disputes, discrimination claims, or labor law violations.
-
Employee Grievances: Number and type of employee grievances filed, with trends over time.
-
Compliance Deadlines: Upcoming deadlines for regulatory filings or required employee certifications.

Dashboard wireframe created using mokkup.ai
Dashboard Features
Real-Time Data
Dashboards provide up-to-date insights, allowing HR teams to take immediate action on pressing issues such as hiring bottlenecks or engagement declines.
Interactive Visualizations
Use graphs, charts, and heatmaps to track performance metrics, identify trends, and visualize survey results
Custom Filters
HR teams can filter data by department, role, location, or time period to gain specific insights.
Predictive Analytics
Leveraging machine learning to predict employee turnover, engagement dips, or skill gaps based on historical data and trends.
Benchmarking
Compare key HR metrics such as salary, employee turnover, or engagement scores to industry benchmarks or internal targets.
Compliance Alerts
Automated alerts to ensure that all HR compliance-related tasks are completed on time, such as mandatory training or regulatory filings
How We Deliver HR Analytics
At GrowthBI, we offer a straightforward process to help you take control of your sales data and turn it into a powerful tool for growth:
Here's how it works:

We Create a Dashboard Mockup
You receive a custom design in 1 to 2 days that focuses on workforce performance, turnover, DEI, hiring metrics, or other areas important to your organization.
01
We Build Your Data Infrastracture
Our team connects your HRIS, ATS, survey tools, and spreadsheets, then builds a consistent data foundation that reflects your teams and reporting lines.
02
We Create Dashboard With Drill Down Functionality
With drill-down functionality, you can explore trends in engagement, and performance to inform hiring, training, and workforce planning.


