Build a Power BI Marketing Dashboard for Executive Insight
- GrowthBI

- Aug 10, 2025
- 7 min read
A marketing dashboard translates complex campaign data into clear insights. It draws a straight line from marketing spend to bottom-line results like revenue and new customers, which allows you to make more confident decisions.
Senior leaders do not have time to review separate spreadsheets from Google Ads, LinkedIn, and their CRM. They need a consolidated view that answers one fundamental question: "Is our marketing investment driving growth?"
A Power BI marketing dashboard delivers exactly that. It pulls scattered data sources into a single report. This provides a holistic picture of performance instead of requiring weeks for manual updates. This approach allows you to shift from reacting to problems to proactively guiding your strategy
A great dashboard transforms marketing from a perceived cost center into a measurable engine for revenue. It provides the clarity needed to hold teams accountable and tie marketing activities directly to financial goals.
This shift toward data-driven strategy is becoming fundamental for businesses across Australia. The national data analytics market was valued at AUD 2.00 billion and is projected to hit AUD 19.08 billion by 2034, growing at a compound annual growth rate of 25.30%. This trend highlights how essential platforms like Power BI are for staying competitive. You can read more about how Australian companies are using data for better decision-making on Codewave.com.
Here is a quick look at the core metrics that should be on every executive's radar.
Core Marketing Metrics for Your Executive Dashboard
This table outlines the essential KPIs that every senior decision-maker should track, along with the critical business question each metric helps answer.
Metric | What It Measures | Key Business Question Answered |
Customer Acquisition Cost (CAC) | The total cost to acquire one new customer. | "How much are we spending to get each new customer?" |
Marketing ROI | The revenue generated from marketing efforts divided by the cost. | "Is our marketing spend generating a positive return?" |
Lead-to-Customer Conversion Rate | The percentage of leads that become paying customers. | "How effective is our sales and marketing funnel?" |
Customer Lifetime Value (CLV) | The total revenue a business can expect from a single customer. | "Which customer segments are most valuable to the business?" |
Marketing-Sourced Revenue | The percentage of total revenue directly attributable to marketing. | "How much of our revenue is marketing directly responsible for?" |
Tracking these metrics is about having the right conversations and focusing the entire team on what truly matters for growth.
An executive dashboard cuts through the noise. You can explore how Power BI delivers clarity for executive decisions in our detailed guide. It empowers leadership to focus on high-level strategy, confident that every marketing dollar is being tracked, measured, and optimized effectively.
Connecting and Preparing Your Marketing Data
A powerful dashboard is built on a foundation of solid data. Before you can visualize your marketing performance in Power BI, you must pull all your information together from the various platforms your team uses. The goal here is to create a single source of truth that everyone can rely on.
Power BI has many built-in connectors that make this part relatively painless. For most marketing teams, the common sources are:
CRM Systems: Your CRM, like Salesforce, holds critical information on leads, opportunities, and who becomes a paying customer.
Web Analytics: Google Analytics is a valuable source for understanding website traffic, user actions, and conversions.
Advertising Platforms: You need performance data from your ad platforms, whether it's Google Ads, LinkedIn Ads, or Facebook Ads. This gives you the spend, reach, and engagement metrics.
Why You Cannot Skip Data Transformation
Simply connecting these sources is not enough. The raw data needs to be cleaned and standardized. This process, often called transformation, is critical. Power BI's tool for this is Power Query. Getting this right is what separates a useful report from a misleading one.
The solution is to use Power Query to standardize items like campaign names. By making sure every related piece of data is tagged under the one "Q4 Product Launch" name, you confirm all costs and results are rolled up together. This is how you get a true picture of your campaign's return on investment.
Designing a Dashboard for C-Suite Clarity
When you build a Power BI marketing dashboard for the C-suite, remember your audience. A CEO needs a strategic summary. The point is to design for clarity and speed that gives a leader the big picture in seconds.
The best way to do this is a 'top-down' approach.
This means putting the most critical, high-level business metrics right at the top. This is your executive summary. We are talking about the numbers that directly link marketing effort to the bottom line, like Customer Acquisition Cost (CAC), overall Marketing ROI, and total Marketing-Sourced Revenue.
Once you have that high-level view sorted, the real value is in the drill-down capability. This lets a leader dig into the "why" behind the numbers without having to ask for another report.
Enabling Strategic Drill-Downs
Imagine your CEO is looking at the overall CAC metric. Instead of just seeing the number, they should be able to click on it. That click could then instantly reveal a detailed breakdown of CAC by channel: Organic Search vs. Paid Social, for example. This immediately answers crucial questions about what is driving costs or which channels are performing well.
This single capability turns a static report into a dynamic tool. It empowers executives to follow their train of thought naturally, moving from a top-level KPI to the underlying drivers without leaving the dashboard. In Australia's fast-moving business world, getting to these insights quickly is a massive advantage. You can find out more about how real-time Power BI dashboards aid Australian marketers on Dear Watson's blog.
Choosing the Right Visualizations
For a C-suite audience, your visuals need to be simple and impactful. To make the most of your space, pick visuals that tell a clear story:
Scorecards: Perfect for crucial figures like total monthly leads or overall marketing spend.
Line Charts: These are your go-to for showing trends over time. Think month-on-month changes in website traffic or lead conversion rates.
Bar or Column Charts: Nothing beats these for direct comparisons, like showing the ROI of different marketing campaigns side-by-side.
By being deliberate with these elements, you will build a dashboard that is an intuitive tool for a busy executive, not just a collection of charts.
Building High-Value Reports in Your Dashboard
An effective Power BI marketing dashboard is more powerful when you think of it as a collection of focused reports, each designed to answer a specific business question. It is like a strategic playbook where every page focuses on a critical part of your marketing engine that lets you move from a high-level view to the details with a single click.
So, what reports should be in your playbook? There are five must-haves for any executive-level dashboard. I recommend building each one as its own interactive page.
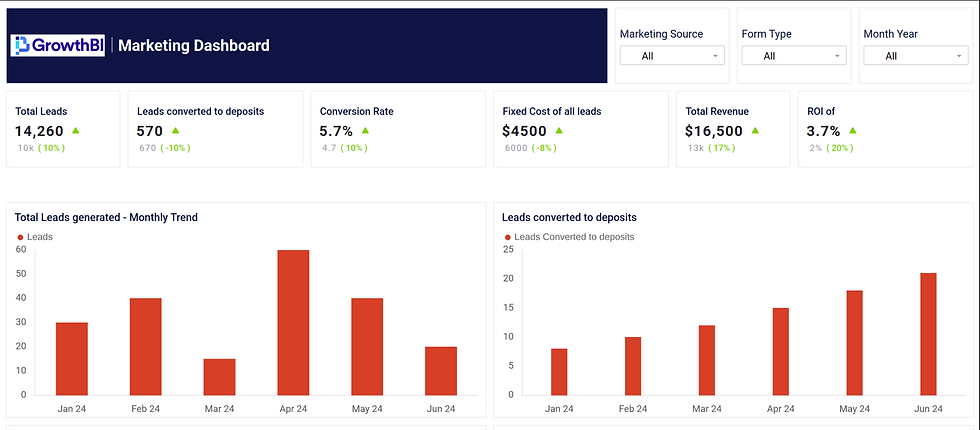
1. CMO Dashboard
A CMO Dashboard provides a bird's-eye view of all marketing activities and their direct impact on business growth. With this dashboard, the CEO can instantly see whether marketing investments are translating into pipeline growth and revenue, tracking key metrics like Marketing Qualified Leads (MQLs), Customer Acquisition Cost across all channels, and marketing's contribution to closed deals.
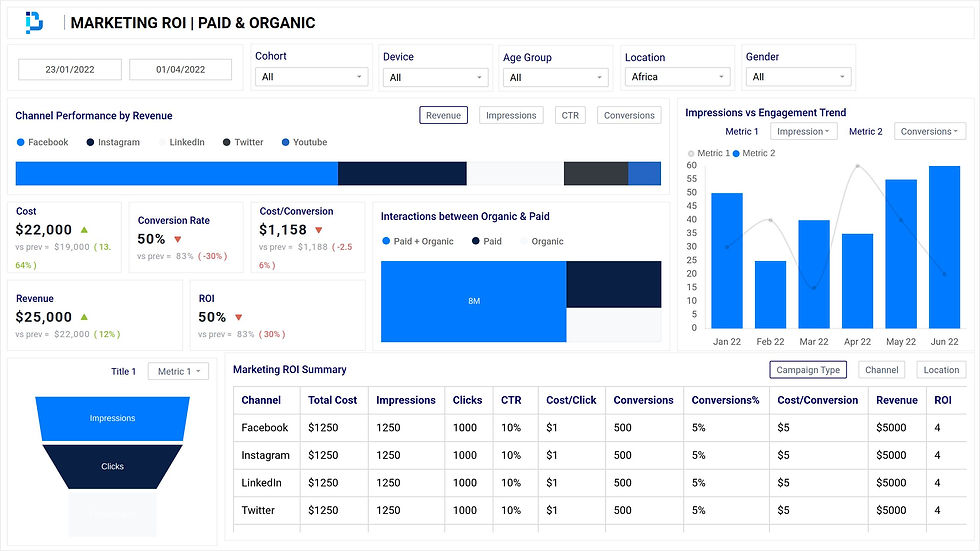
2. Paid Campaign Performance Dashboard
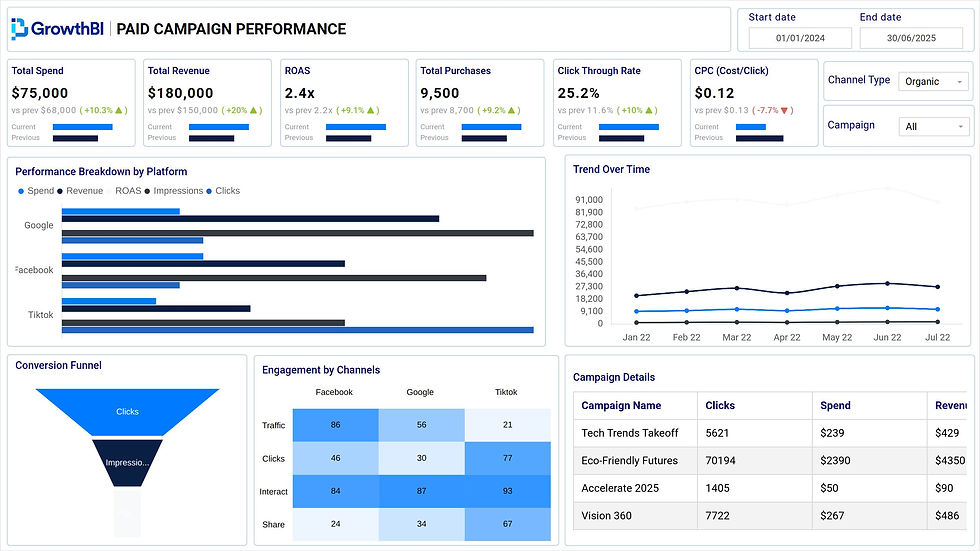
A Paid Campaign Performance Dashboard delivers real-time visibility into the effectiveness and efficiency of all paid advertising efforts across platforms like Google Ads, LinkedIn, and Facebook. With this dashboard, the CEO can immediately identify which campaigns are driving the highest-quality leads at the lowest cost, spot underperforming ad spend that's draining budget, and compare ROI across different advertising channels.
3. Social Media Performance Dashboard

A Social Media Performance Dashboard transforms social media metrics into business-relevant insights by connecting engagement, reach, and follower growth to actual lead generation and brand awareness goals. With this dashboard, the CEO can instantly assess whether social media efforts are building meaningful brand equity and driving qualified traffic to the website, while tracking sentiment analysis and competitor performance benchmarks.
4. Marketing Funnel Dashboard

A Marketing Funnel Dashboard provides complete transparency into how prospects move through each stage of the customer journey, from initial awareness to final purchase. With this dashboard, the CEO can immediately pinpoint where potential customers are dropping off, whether it's during lead capture, nurturing sequences, or the final sales handoff, and see conversion rates at each critical stage.
5. Email Marketing Performance Dashboard
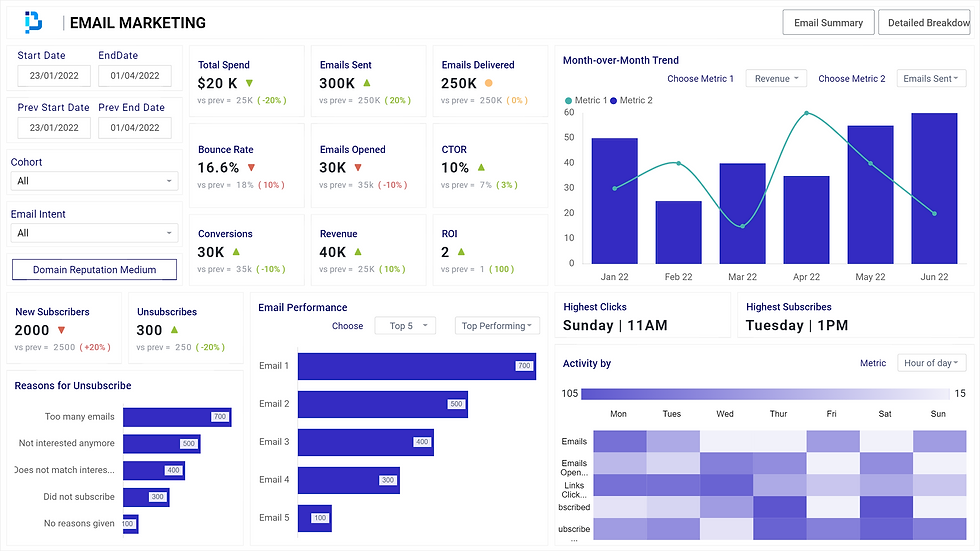
An Email Marketing Performance Dashboard converts email campaign data into actionable insights about customer engagement, retention, and revenue generation from email efforts. With this dashboard, the CEO can instantly see which email campaigns are driving the most revenue, track customer lifecycle engagement patterns, and monitor list health metrics like deliverability and unsubscribe rates.
Sharing the Dashboard to Nurture a Data-Driven Culture
Building a great Power BI marketing dashboard is one thing. Getting people to use it to make smarter decisions is where the real value is created.
It all starts with sharing it in a secure way. Power BI workspaces are perfect for this. You can give your wider marketing team view-only access, while the leadership team gets the full interactive experience. This keeps the data clean and confirms the right people have the right level of control.
When leadership consistently reviews the numbers, those numbers become what everyone else cares about. The dashboard stops being a 'nice-to-have' report and becomes the engine for real strategic discussion. It builds accountability directly into your meetings.
By making the dashboard a core part of how your business operates, you build a culture where decisions are guided by data. A well-built Power BI marketing dashboard is about giving you the clarity to lead with confidence. At GrowthBI, we specialize in creating these systems to turn scattered data into your most valuable strategic asset. If you are ready to swap fragmented spreadsheets for real-time insights, book a discovery call with our team today.


