How Data and BI Power AI Clean Infrastructure Semantic Layers and Context for Smarter Automation

AI projects rarely fail because the model is not clever enough. They fail because the data is messy, the meaning is unclear, or the system acts without enough context.
A model can classify support tickets, forecast demand, recommend products, detect fraud, or answer questions in plain English. Yet every one of those tasks depends on work that often starts long before anyone opens a machine learning notebook. It starts with data engineering, business intelligence, metric definitions, governance, and the day-to-day habit of asking, “Do we trust this number?”
That is why data and BI projects are not side quests to AI. They are the ground the AI stands on.
A business intelligence dashboard might seem far removed from an AI assistant or an automated decision engine. In practice, BI is where many organisations learn how their data behaves. It reveals duplicate customers, missing product codes, mismatched time zones, unclear definitions, and manual fixes hidden inside spreadsheets. These are not small details. They are the same issues that can cause an AI system to recommend the wrong action, train on the wrong labels, or give a confident answer based on weak evidence.
The organisations getting real value from AI tend to have something in common. They have put serious effort into clean data infrastructure, shared semantic layers, and clear business context.

AI is only as useful as the data it learns from
AI systems learn patterns from examples. If the examples are incomplete, biased, stale, or poorly labelled, the system will learn those flaws too.
Clean data infrastructure gives AI three things it needs:
Reliable inputs
The same customer, product, asset, or transaction should not appear in five different forms across five systems.
Consistent history
AI needs historical data to learn patterns. Gaps, unexplained changes, and broken timestamps make that harder.
Trusted labels and outcomes
A fraud model needs to know which transactions were truly fraudulent. A churn model needs a clear definition of churn. A demand forecast needs clean sales, stock, returns, and promotion data.
BI projects expose these problems early because dashboards make data visible. When a sales dashboard does not match the finance report, people ask why. That question often uncovers deeper issues: duplicated records, late-arriving data, unclear ownership, or different teams using different definitions for the same metric.
For AI, those differences can become expensive.
Imagine a retailer training a model to forecast demand. The sales table includes online orders, store purchases, returns, cancelled orders, and internal stock transfers. If those events are not clearly separated, the model may treat a warehouse transfer as true customer demand. It may learn that a product is popular in a store where it was never actually sold. The result is poor stock placement, wasted transport, and staff losing trust in the system.
The model did not fail alone. The data foundation failed first.
Clean data infrastructure turns raw records into useful training material
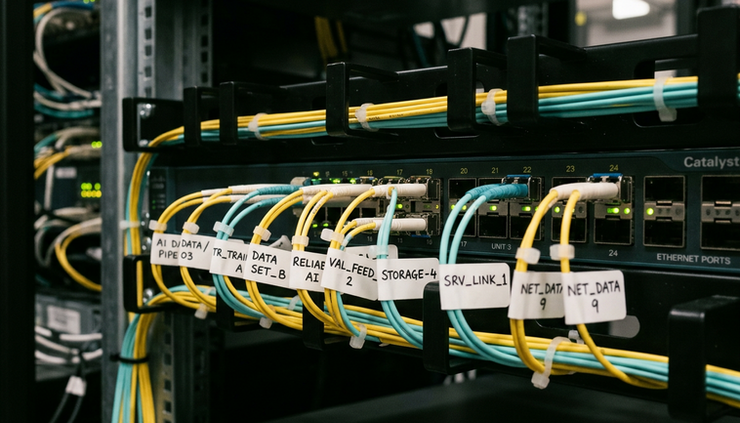
Clean data infrastructure is not just a data warehouse or a lake. It is the set of systems, rules, processes, and ownership that makes data fit for repeated use.
A strong foundation usually includes:
Data pipelines that move information from source systems into shared stores
Quality checks that catch missing, invalid, or unusual values
Master data for core entities such as customers, products, suppliers, assets, and locations
Clear ownership for key datasets
Lineage so teams can see where a field came from and how it changed
Access controls that protect sensitive data
Documentation that explains what tables, fields, and metrics mean
This work can sound less exciting than building an AI assistant. Yet it has a direct effect on model accuracy, safety, and cost.
Poor infrastructure creates rework. Data scientists spend time cleaning one-off extracts. Analysts maintain conflicting spreadsheets. Engineers rebuild the same pipelines for each new use case. AI teams train models on datasets that cannot be reproduced later. When the model behaves strangely, no one can easily trace the issue back to a source.
Good infrastructure creates reusable data. A demand forecast, pricing model, BI dashboard, and automated stock alert can all draw from the same governed product and sales data. That shared base reduces confusion and makes the whole system easier to improve.
A real example from logistics
UPS has long been known for using data to improve delivery routes through its ORION system. Public descriptions of ORION show that route guidance depends on more than a clever algorithm. It uses detailed information about packages, delivery points, driver routes, maps, and business rules.
That type of system needs clean operational data. A delivery address must be accurate. A road segment must connect properly to the map. A package must be tied to the correct stop. A driver’s route history must be readable by the system. If the data is weak, the route recommendation becomes weak too.
The lesson for AI teams is simple. Automation works best when the physical world has been translated into clean, structured, trusted data.
A real example from retail
Large retailers use demand forecasting to decide what to place on shelves, in warehouses, and on delivery routes. The AI task sounds simple: predict future demand. The data task is much wider.
A useful forecast may need:
Sales transactions
Stock on hand
Product hierarchy
Store location
Promotions
Weather
Public holidays
Supplier lead times
Returns
Substitutions when items are out of stock
If the BI team has already built trusted sales reporting and product hierarchy reporting, the AI team starts ahead. If those reports are still debated every week, the AI model will inherit the same confusion.
This is one reason BI maturity often predicts AI readiness. A clear, trusted revenue dashboard is not just a report. It is proof that the organisation can agree on data definitions, fix quality issues, and maintain shared truth over time.
BI problem | AI consequence |
Customer records are duplicated | Personalisation models learn fragmented behaviour |
Product categories are inconsistent | Forecasts compare items that should not be grouped |
Metrics differ across teams | AI assistants give different answers to the same question |
Manual spreadsheet fixes are not captured | Training data does not match how the business really operates |
Data refresh times are unclear | Automation acts on stale information |
Semantic layers help AI understand what the data means
Clean data tells AI that a field exists and has a valid value. A semantic layer tells AI what that field means.
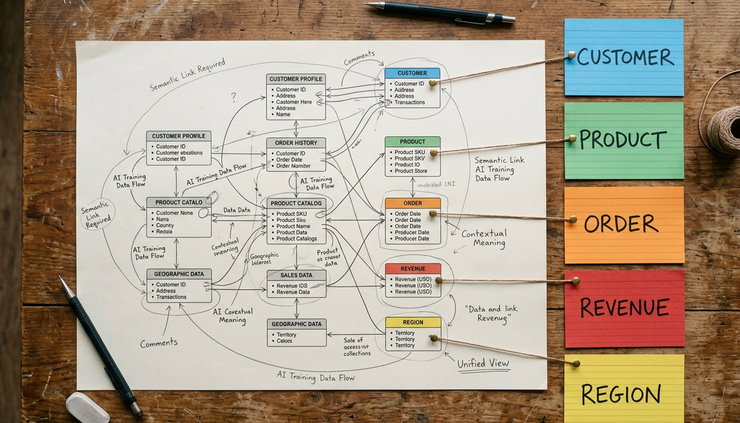
A semantic layer is a shared business meaning layer that sits between raw data and the tools people use. It defines metrics, dimensions, relationships, hierarchies, and rules in a way that is consistent across dashboards, reports, and AI applications.
For example, a semantic layer can define:
What counts as an active customer
How gross margin is calculated
Which date field should be used for revenue reporting
How products roll up into brands, categories, and departments
Which regions belong to which sales territories
Whether cancelled orders are included in order volume
Without this layer, an AI assistant connected to a database may see tables and columns but miss the business meaning. It might find a column called `revenue`, another called `net_sales`, and another called `sales_amount`. It may not know which one matches the finance team’s official number.
A semantic layer gives the AI a map.
That map matters even more when people ask questions in natural language. Someone might ask, “Why did customer retention fall in Queensland last month?” To answer well, the system needs to know what retention means, which customers count, how Queensland is assigned, which calendar the business uses, what “last month” means in the reporting cycle, and which data is approved for that answer.
A language model can form the sentence. The semantic layer helps it ground the answer in the right meaning.
Airbnb’s metrics work shows why definitions matter
Airbnb has publicly discussed its work on metric platforms, including Minerva, to bring consistency to how metrics are defined and used. The general problem is common in growing organisations. Teams create their own versions of key metrics. Experiments, dashboards, and product decisions can drift because one team’s “booking” or “active user” may not match another team’s version.
A shared metrics layer helps reduce that drift. Once a metric is defined centrally, different tools can use the same logic. Analysts can build reports from it. Experiment systems can measure with it. AI tools can query it.
That is the link between BI and AI. The semantic layer that makes dashboards consistent can also help AI agents answer questions and trigger automated workflows without inventing their own definitions.
Looker, Power BI, dbt, and the rise of shared meaning
Many organisations now use BI and analytics tools that support modelling layers, metric stores, or semantic definitions. The names differ across platforms, but the goal is similar: move business logic out of scattered reports and put it somewhere shared.
This matters because AI systems are increasingly being connected to business data. A chat interface over a warehouse is useful only if the AI can safely interpret what it finds. Without a semantic layer, each question becomes a guessing exercise.
A good semantic layer does not need to define every possible concept on day one. It should start with the terms that drive decisions:
Revenue
Margin
Customer
Order
Churn
Inventory
Utilisation
Risk
Service level
Forecast accuracy
Once those terms are clear, AI can support more complex tasks. It can explain changes, compare segments, flag unusual movement, and suggest next steps based on definitions the organisation already trusts.
Context turns automation into better decision-making
Automation without context can be fast and wrong.
An AI system may know that a customer has lodged three support tickets in a week. That fact alone might trigger a retention offer. With better context, the system may see that the tickets relate to a known outage, the customer is on a low-margin plan, the account has already received a credit, and the service team has a policy for that issue. The best next action may be an apology and a technical update rather than a discount.
Context includes the extra information that shapes a decision:
Business rules
Customer history
Product status
Contract terms
Risk level
Confidence scores
Recent events
Policy constraints
Human approvals
Source freshness
Exceptions and edge cases
BI teams already deal with context every day. A revenue chart needs notes about seasonality, price changes, campaigns, stock shortages, or accounting adjustments. An operations dashboard needs to show whether a delay is normal, urgent, or caused by a planned outage. The same thinking applies to AI automation.
AI does not need every detail. It needs the right detail at the point of decision.

A customer service example
Consider a utility provider using AI to help classify and route customer messages. A model can read a message and detect that it relates to billing. That is useful, but not enough.
The decision improves when the AI also receives context:
The customer’s account status
Recent meter readings
Billing cycle dates
Payment plans
Known service incidents
Complaint history
Regulatory handling rules
The confidence level of the classification
With that context, the system can route urgent complaints to a specialist team, answer simple balance questions automatically, and flag cases that need human review. The AI is not just reading text. It is acting inside a controlled decision process.
A banking example
Banks use AI and rules-based systems to detect suspicious transactions. A card purchase in another country may look risky. With context, the system can make a better call. Did the customer recently buy flights? Is the merchant known? Does the spending pattern match earlier travel? Has the customer used the bank’s travel notice feature? Is the amount unusual for this account?
The answer may still be to block or challenge the transaction, but the quality of the decision improves when the system can see more than a single event.
This is where BI, data platforms, and AI meet. BI defines and monitors the patterns. Data infrastructure makes the signals available. AI applies those signals quickly, with rules and human review where needed.
A mining and asset maintenance example
In Australia, mining, energy, transport, and utilities organisations often manage expensive physical assets across large distances. Predictive maintenance is a common AI use case. Sensors can detect vibration, heat, pressure, or unusual operating patterns. The model may predict that a component is likely to fail.
That prediction is only one part of the decision.
A maintenance system also needs context:
Where the asset is located
Whether spare parts are available
The current production schedule
Safety requirements
Crew availability
Weather and access conditions
The cost of stopping now versus later
The history of similar alerts
A model may say, “Failure risk is rising.” The business decision is, “Should work stop now, at the next planned window, or after inspection?” A BI-style view of operations, costs, safety, and schedules helps turn the prediction into a practical action.
BI projects create the habits AI needs
The best BI work does more than produce dashboards. It builds habits that AI projects need to succeed.
Teams learn to agree on definitions
AI projects slow down when people cannot agree on what the target means. Is churn a cancelled subscription, no purchase for 90 days, or a drop in usage? Is a lead qualified when sales accepts it, when budget is confirmed, or when a meeting is booked?
BI work forces these questions into the open. Dashboards need definitions. Reports need sign-off. Metric owners need to explain changes. This creates the shared language AI needs.
Data quality becomes visible
Many data issues stay hidden until someone tries to report on them. A dashboard can show missing regions, strange spikes, negative quantities, or duplicate records. Fixing those problems for BI also improves future AI training data.
Quality checks should move upstream over time. Instead of finding issues in a dashboard after the fact, teams can catch them when data enters the platform.
Useful checks include:
Required fields are present
Codes match approved lists
Dates fall within valid ranges
Totals reconcile with source systems
Duplicate records are flagged
Unusual changes trigger review
Sensitive fields are masked or restricted
These checks make reporting more trustworthy. They also stop AI systems from learning avoidable errors.
Analysts become AI translators
Analysts often understand both the data and the business question. That makes them valuable in AI projects. They can help define targets, test outputs, compare model behaviour with known reporting, and spot when an answer is technically correct but commercially weak.
For example, an AI model may recommend reducing stock for a slow-moving item. An analyst may know the item is seasonal, bundled with another product, or due for a promotion. That context can stop a poor automated decision.
AI does not remove the need for analysis. It raises the value of people who can connect data, process, and judgement.
Case studies show the same pattern across industries
The link between data, BI, and AI appears across very different sectors. The tools change, but the pattern stays the same.
Better AI usually comes from better data products, clearer definitions, and richer context, not from the model alone.
Netflix and recommendation systems
Netflix is widely known for using recommendations to help viewers find content. A recommendation engine needs far more than a list of videos and ratings. It needs consistent data about viewing behaviour, titles, genres, devices, search, time, language, and user interactions.
The BI-like work behind this is significant. Teams need shared definitions for viewing, completion, engagement, and content attributes. They need clean events that record what happened and when. They need feedback loops to see whether recommendations are useful.
The lesson is not that every organisation should build Netflix-style personalisation. The lesson is that personalisation depends on a well-instrumented product and clear behavioural data.
Spotify and music discovery
Spotify’s recommendation and discovery features also depend on many forms of data, including listening behaviour, playlists, audio attributes, and user interactions. The user-facing AI feels simple. Play a song, skip a song, save a track, follow an artist. Behind the scenes, each action becomes a signal.
For a business, this shows the value of clean event design. If user actions are tracked inconsistently, AI cannot learn reliable preferences. If product or content metadata is weak, recommendations become less relevant. If teams disagree on engagement metrics, it becomes harder to test whether the system is improving.
Airbnb and shared metrics
Airbnb’s public engineering discussions around metric consistency show another side of the same issue. In a marketplace, small definition changes matter. Hosts, guests, bookings, nights, cancellations, search results, and conversion can be counted in different ways.
For BI, inconsistent definitions create conflicting reports. For AI, they can shape the wrong target. A ranking model, pricing tool, or automated experiment system needs stable metrics to measure outcomes. A shared metrics and semantic layer helps keep those systems tied to agreed business meaning.
Public sector and service triage
Public sector agencies often use data to prioritise services, manage demand, and route cases. AI can help classify requests or identify cases that need early attention. Yet the work must be carefully governed because the decisions affect people.
Clean data matters, but so does context. A case record may show a missed appointment. The reason could be transport access, language needs, caring responsibilities, or a system error. Automation that ignores context may produce unfair or unhelpful decisions.
This is a strong reminder that AI systems need human oversight, explainability, and clear limits, especially when decisions affect customers, citizens, workers, or communities.
Building AI-ready BI does not require a grand rebuild
Many organisations assume they need a massive platform replacement before they can use AI well. Sometimes systems do need major work. More often, the best path starts with a focused business problem and improves the data foundation around it.
A practical approach looks like this.
Choose a decision, not a technology
Start with a decision that matters and repeats often. Examples include:
Which support tickets need urgent review?
Which customers are likely to leave?
Which stock items should be reordered?
Which invoices may be incorrect?
Which assets need inspection?
Which sales leads should be followed up first?
A clear decision gives the data work direction. It shows which sources, definitions, and context are needed.
Audit the data behind the decision
Trace the data used today. Find the source systems, manual edits, spreadsheets, reports, and business rules. Ask where people already disagree.
Useful questions include:
Which fields are trusted?
Which fields are often corrected manually?
Which definitions vary by team?
Which records are missing or duplicated?
How fresh does the data need to be?
Who owns the data?
Which privacy or security rules apply?
This audit often reveals that the AI project is also a BI improvement project.
Create a small semantic layer around the use case
Do not try to model the whole organisation at once. Define the key entities and metrics for the chosen decision.
For a churn use case, that may include:
Customer
Subscription
Product
Usage
Support contact
Renewal date
Churn event
Retention offer
Customer value
Document each definition. Put calculation logic in a shared layer where reports and AI systems can use the same version.
Add context before adding automation
Before an AI system acts, decide what context it needs. A risk score alone is rarely enough.
For each automated recommendation, define:
The inputs used
The confidence level required
The business rules that apply
The cases that need human review
The data freshness needed
The explanation shown to users
The feedback captured after action
This keeps automation connected to real decision-making. It also makes the system easier to monitor.
Use BI to monitor AI after release
AI systems change behaviour as data changes. Customer behaviour shifts. Products change. Processes change. A model that worked well last year may weaken.
BI dashboards can monitor AI operations, including:
Input data quality
Volume of automated decisions
Approval and override rates
Model confidence patterns
Outcome measures
Error types
Segment-level performance
Human feedback
This turns BI into a control system for AI. It helps teams see when automation is helping, when it is drifting, and when it needs review.
The risks of skipping the BI groundwork
When organisations rush into AI without data and BI foundations, the same problems appear again and again.
The AI assistant gives different answers depending on which table it queries. A forecasting model cannot explain why its output changed. Automated workflows trigger from stale data. Customer records do not match across systems. Sensitive data appears where it should not. Staff stop trusting the system and return to spreadsheets.
These are not AI problems in isolation. They are signs that the data environment has not been prepared.
Skipping the BI groundwork can also create governance risk. If no one owns the definition of a metric, who is responsible when an AI tool uses it in a decision? If no one tracks data lineage, how can a team explain an automated outcome? If business rules live in individual reports, how does an AI agent know which rules apply?
Strong data and BI practices do not remove all risk, but they make risk easier to see and manage.
What good looks like when BI and AI work together
A healthy BI and AI environment has a few clear signs.
People can find trusted data without asking five teams. Key metrics have owners and plain-language definitions. Dashboards and AI tools use the same semantic layer. Data quality issues are logged and fixed near the source. Automated recommendations include context, confidence, and reasons. Humans can review sensitive decisions. Feedback from real outcomes flows back into reporting and model improvement.
The experience also feels different for users. Instead of asking, “Where did this number come from?” they can ask, “What should we do next?” Instead of debating definitions, teams can compare options. Instead of treating AI output as magic, they can inspect the data, logic, and context behind it.
That is where AI becomes practical. It stops being a standalone experiment and becomes part of the organisation’s decision system.
The path to smarter automation runs through familiar work: clean tables, trusted reports, shared definitions, useful context, and steady governance. BI teams have been building these muscles for years. AI raises the stakes, but it also increases the value of that work.
If the goal is better AI, the next step may not be a bigger model. It may be fixing the customer table, agreeing on churn, documenting revenue logic, or adding the context an automated decision has been missing. Clean infrastructure, semantic layers, and business context are not background tasks. They are the power source.