A CEO's Guide to Data-Driven Decision Making
- GrowthBI

- Sep 5
- 8 min read
Data-driven decision making is the practice of using facts and metrics to guide business strategy. For a mid-size company, this transition is critical. It moves a business from simply observing performance to analyzing it.
In today's business environment, relying on intuition alone is a significant gamble. As a leader in a mid-size company, you face constant pressure to make correct decisions on inventory levels, market entry, and other strategic issues. A systematic approach to data is a fundamental requirement for survival and growth.
Decisions made without sufficient information lead to tangible losses that can accumulate rapidly. An e-commerce business, for instance, might order a large volume of a product based on its strong sales in the previous year. If the business had reviewed recent website analytics, it would have seen that customer interest was declining. Now, it holds excess inventory and has tied up valuable capital.
A data-driven approach provides the clarity needed to navigate difficult situations like economic downturns or supply chain disruptions. It helps you answer the most important business questions with evidence.
When a leadership team has the right metrics, the nature of the discussion changes. It moves from "I think we should do this" to "The data shows this is our best course of action." This shift improves team alignment and allows everyone to execute with greater speed and confidence.
The transition to data-led business operations is accelerating. In Australia alone, the data analytics market was valued at approximately AUD 2.00 billion in 2024. Projections indicate it will grow to about AUD 19.08 billion by 2034, as businesses increasingly use analytics to gain an advantage. You can explore these trends in more detail at Codewave.
This growth highlights a simple truth. Companies that effectively use their data are better positioned to:
Identify market opportunities before competitors.
Optimize operational costs with precision.
Increase customer retention by understanding their behavior.
Forecast financial outcomes with greater accuracy.
Building a data-driven culture makes an organization more resilient and adaptable. It provides the tools to anticipate market changes.
Building a Data Strategy
An effective data-driven decision-making process begins with a clear strategy. This strategy must be focused on business outcomes. The goal is to answer the most critical questions facing the organization.
This requires resisting the temptation to address all issues at once. Instead, direct your energy where it will produce a tangible result.
The process starts with leadership identifying specific operational or financial challenges. A good starting point is to ask, "What one piece of information, if available, would fundamentally improve our performance?" This question helps define the Key Performance Indicators (KPIs) that truly measure progress toward your most important goals.
Identify Your Most Critical Questions
The first step is to pinpoint one or two high-value business areas. Vague ambitions like "improving efficiency" are too broad. You need to be specific.
Imagine a healthcare provider that wants to reduce patient wait times and optimize clinic space utilization. Instead of an undefined project, its critical questions might be:
What is the average time between a patient's scheduled appointment and the actual consultation?
Which clinicians have the most availability, and at what times?
What is our patient no-show rate, and are there identifiable patterns?
By concentrating on these questions, the provider knows exactly what data to collect: appointment times, clinician schedules, and patient attendance records. This targeted approach delivers useful insights without requiring a complete overhaul of its data systems.
Start Small to Demonstrate Value
A focused strategy delivers quick wins, which are vital for building momentum and securing long-term team support. This approach aligns with national efforts to increase data maturity.
When you start with a manageable scope, you create a clear path to success. Our guide on developing a practical data strategy framework for mid-sized companies provides more detail on this initial phase. This method makes your first step into data-driven decisions both successful and scalable.
The objective is to achieve a measurable win. Answering one important question with data is more powerful than attempting to answer twenty questions with incomplete information. This success proves the concept and justifies future investment in your data capabilities.
Tackling the Two Biggest Roadblocks: Data Quality and Team Alignment
A brilliant data strategy will fail if it encounters two common roadblocks: poor data quality or a team that is not aligned. Without reliable information and genuine buy-in from your people, any investment in analytics will not deliver the expected returns.
If one site manager tracks labor hours in a spreadsheet and another uses a different application, the data sent to the head office will be inconsistent. This inconsistency leads to inaccurate project cost estimates, reduced profit margins, and unreliable financial forecasts.
Businesses across Australia are grappling with these fundamental issues. A recent report found that only 7% of Australian organizations feel 'very effective' at using their data and analytics. This statistic highlights a significant gap between the desire to be data-driven and the reality of having the accurate data needed for sound decisions.
The trend is clear: mastering your data provides returns in both financial performance and operational agility.
Putting Basic Data Governance in Place
How do you avoid the fate of the construction company? You start with basic data governance. It is about establishing a few simple ground rules.
Here is where to begin:
Create a Simple Data Dictionary: This is a document that defines your key business terms. For our construction example, it would mean creating a standard definition for "Labor Hours" or "Material Codes" that everyone across all sites must use. This eliminates ambiguity.
Assign Clear Ownership: Make a specific person or department accountable for the quality of key metrics. When someone "owns" a number, its accuracy typically improves quickly.
For a more detailed explanation, we have created a guide on how to improve data quality with proven strategies that offers more in-depth techniques.
To help you begin, I have outlined some of the most common data quality challenges that mid-sized companies face, along with practical first steps.
Data Quality Hurdles and Practical Solutions
Common Hurdle | Business Impact Example (Scenario) | Practical First Step |
Inconsistent Data Entry | A retail business has multiple staff entering customer postcodes differently (e.g., "3000," "3,000," "VIC 3000"). This makes it impossible to analyze sales by location accurately. | Create a simple data entry guide for the team and use dropdown menus or field validation in your systems to enforce a standard format. |
Duplicate Records | The marketing team sends the same promotional email three times to one lead because they exist under different names ("John Smith," "J. Smith," "John S."). This irritates customers and wastes resources. | Run a de-duplication audit on your CRM. Start with one key field, like email address, to identify and merge obvious duplicates. |
Outdated Information | The sales team wastes time calling disconnected numbers because the contact details in the CRM have not been updated in over a year. Morale declines and opportunities are lost. | Implement a simple quarterly process where sales representatives are prompted to review and confirm the contact details for their top 20 accounts. |
Lack of Context (No Metadata) | An analyst finds a dataset labeled "Q3 Sales" but does not know if it includes GST, which year it is for, or if returns have been deducted. The data is unusable without this context. | Insist that all reports or data exports include a "Notes" tab or section that explains what the data represents, its source, and the date it was retrieved. |
Establishing these basics provides the foundation for all other efforts. It builds trust in the numbers and makes the entire process more efficient.
The real aim is to frame data as a shared tool that helps everyone perform their jobs better. When your team sees that clean data makes their work easier and more successful, they will become your strongest advocates for maintaining it.
Turning Raw Data into Clear Business Insights
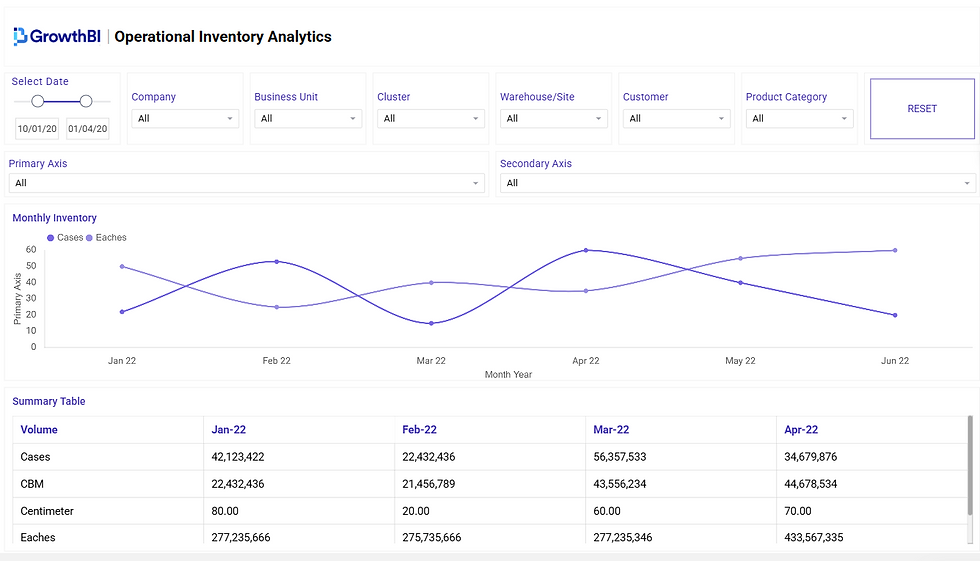
You have reliable data. What is the next step? The value is realized when you transform raw numbers into something your team can understand and act upon. This is the function of business intelligence dashboards, which translate complex datasets into narratives that provide answers quickly.
There is a significant difference between a static report and an interactive dashboard. Consider a standard monthly report for a SaaS company. It might show a simple list of churn numbers. This is information, but it is retrospective and lacks context.
An interactive dashboard, in contrast, makes that data dynamic. It allows your leadership team to see churn trends over time, segment that data by different customer groups, and perhaps identify a correlation with a recent increase in support tickets. This is how you transition from merely possessing data to actively using it to make better decisions.
Designing Dashboards That Drive Decisions
Effective dashboards are carefully designed tools, each built to serve a specific business function. My experience shows that the most successful dashboards adhere to a few core principles.
A dashboard needs a purpose. It is much more effective to build dedicated dashboards for different parts of the business.
Sales Performance: You would want to see pipeline health, conversion rates, and team performance against quotas.

Dashboard wireframe created using mokkup.ai Operational Efficiency: This dashboard would focus on production output, supply chain costs, and equipment uptime.
Financial Health: Concentrate on cash flow, gross margin, and accounts receivable.

Marketing ROI: Here, you visualize campaign results, cost per lead, and customer acquisition cost (CAC).

Dashboard wireframe created using mokkup.ai
A great dashboard tells a story. When a leader views it, they should be able to answer their most pressing questions in under 60 seconds.
By adopting this focused approach, you can be confident that every dashboard serves a direct need. You are replacing ambiguity with clear information.
You have completed the difficult work of setting up your strategy and building your dashboards. Now comes the most important part: making it a permanent practice.
Embedding Data into Your Daily Operations
A successful data program is a fundamental shift in how your organization operates daily. The final, and most critical, step is to turn data analysis from a special event into a daily habit for your entire leadership team.
This means integrating data into your existing business routines. It involves making data-backed discussions the standard. When you achieve this, data-driven thinking becomes part of your company's culture.
From Meetings to Coaching Moments
The simplest way to begin is to bring data into the rooms where decisions are already being made. You will notice an immediate change in the conversations. They will shift from being based on feelings and subjective opinions to being grounded in objective evidence.
This single change completely alters their meetings. The discussions become sharper, more focused, and centered on interpreting the data and deciding on clear actions.
This approach works equally well in other areas. A sales manager can use a conversion rate dashboard during one-on-one coaching sessions. Instead of offering generic advice, they can pinpoint exactly where a sales representative is facing challenges in the funnel. The coaching becomes specific, targeted, and much more effective.
The goal is to create a continuous feedback loop. You use data to make a decision, measure the results of that decision in your dashboards, and use those new results to refine your strategy. This cycle drives steady, incremental improvement.
By making data a constant presence in your meetings, coaching, and planning sessions, you build a culture where evidence consistently informs action. This is the ultimate goal of a great data strategy.
Ready to build a data strategy that delivers real business outcomes? The team at GrowthBI specialises in creating custom dashboards and data platforms for leadership teams. Book a discovery call today.

